(注:Michael Pachter。モルガン証券アナリスト。ゲーム関連の予測がよく外れることで有名)
アメリカ 
PS2 Xbox GCN 360 GBA NDS PSP
2000 1,101,038 0 0 0 0 0
2001 6,179,578 1,402,436 1,205,666 4,801,506 0 0
2002 8,387,491 3,169,584 2,258,003 6,743,530 0 0
2003 6,308,783 3,103,570 3,268,266 7,781,263 0 0
2004 4,593,958 4,010,710 2,285,052 7,076,307 1,225,594 0
2005 5,510,000 2,400,000 1,560,000 607,343 4,260,000 2,430,000 3,630,000
Totals 32,080,848 14,086,300 10,576,987 607,343 30,662,606 3,655,594 3,630,000
米国 PS2 NDS PSP 360 PS3 Wii
2000 1,101,038
2001 6,179,578
2002 8,387,491
2003 6,308,783
2004 4,593,958 1,225,594
2005 5,551,000 2,580,000 3,633,000 607,000
2006 4,704,000 5,305,000 3,030,000 3,892,000 687,300 1,080,000
2007 3,946,000 8,430,000 3,824,000 4,619,000 2,557,000 6,290,000
2008 2,500,000 9,951,000 3,829,000 4,735,000 3,544,000. 10,171,000
2009 1,800,000. 11,187,000 2,496,000 4,772,000 4,335,000 9,595,000
累計. 45,446,000. 38,691,000. 16,755,000. 18,661,000. 11,124,000. 27,135,000
市場規模 
北米ゲーム市場規模推移
2001 $9.4 billion
2000 $6.6 billion
1999 $6.9 billion
1998 $6.2 billion
1997 $5.1 billion
出荷ベースまとめ 
499 名前:名無しさん必死だな[sage] 投稿日:2008/07/30(水) 23:49:50 ID:psl88Wbf0
出荷ベースまとめ
Wii PS3 Xbox360 PS3+Xbox360 PS3+Xbox360-Wii
2006/12 319 168 1040 1208 889
2007/03 584 361 1090 1451 867
2007/06 927 432 1160 1592 665
2007/09 1317 563 1340 1903 586
2007/12 2013 1053 1770 2823 810
2008/03 2445 1285 1900 3185 740
2008/06 2962 1441 2030 3471 509
日米英TOP5 
2010 
Global games market worth over $100bn 
http://www.mcvuk.com/news/40635/Global-games-market-worth-over-100bn
It's always been hard to accurately value the total worth of the entire games industry given the trade's mix of large private and public companies.
But canny investment banker Paul Heydon of independent banking firm Avista Partners offered a glimpse into the total value of the market - and where all that money is going - in a stat-packed talk at Edinburgh Interactive this week.
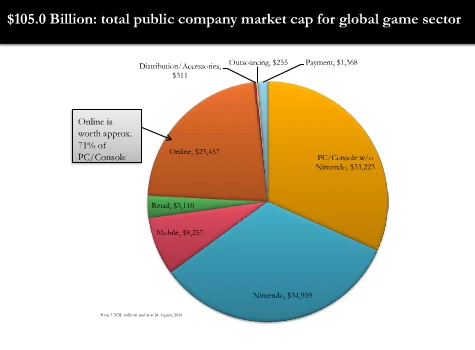
In fact one key factoid in his talk on disruption in games investment was that the total market cap of all public games companies globally had exceeded $100bn - to $105bn to be precise.
The chart below sums up Heydon's findings.
It shows the $105bn broken down as follows:
Nintendo - $34,959m
Other PC/Console (w/out Nintendo) - $33,223m
Online - $23,457m
Mobile - $8,257m
Retail - $3,110m
Payment Services - $1,368m
Distribution/Accessories - $311m
Outsourcing - $255m
While the figures don't include independent developers and small private publishers - they are companies which are arguably in a significant minority when you compare their accounts to the numbers in the chart above - this offers real insight into the market's dynamics, especially when consolidation is such a massive M&A force in games at the moment.
Heydon pointed out that online games - which includes MMO and social/casual games - was now worth around 71% of the non-Nintendo PC/Console area.
He also said that mobile may seem small, but will keep growing, and also eat into the larger shares taken by the Nintendo and non-Nintendo segments. Same goes for Payment Services, which will grow and benefit in line with the rise of online and mobile.
Worst news was for retail and distribution, which Heydon insinuated was stagnating. He later pointed out that investor expectations for the retail sector had devalued by 64%.
2009年 
2009 日米英TOP5 (NPD,ファミ通,GfK-ChartTrack)
計 米 日 英
1位 1186万 882万 *24万 280万 Call of Duty: Modern Warfare 2
2位 *757万 454万 154万 149万 Wii Sports Resort
3位 *741万 423万 249万 *69万 New Super Mario Bros. Wii
4位 *580万 353万 130万 *97万 Wii Fit Plus
5位 *544万 360万 *59万 125万 Wii Fit
http://www.mcvuk.com/features/636/Global-Video-Game-Market-Analysis-2009
2009年度
全体
アメリカ 1兆7900億円 -8%
日本 5400億円 -6.9%
イギリス 4900億円 -18%
ソフト
アメリカ 8990億円 -9.9%
日本 3300億円 -1.8%
イギリス 2400億円 -15%
ハード
アメリカ 6500億円 -8.3%
日本 2200億円 -13.6%
イギリス 1600億円 -25%
- 2009白書
米国がゲームに使ったお金は一年で2兆円・・・欧米各国の市場規模調査 
http://www.inside-games.jp/article/2010/05/14/42035.html
調査会社であるNewzooによれば、米国では2009年に253億ドル(約2兆3384億円)のお金がゲームに使われたとのことです。
これは米国で8歳以上の人を対象とした調査で明らかになった金額。2兆円のうち54%が店頭で新品のゲームを買うのに費やされ、46%はダウンロード販売や中古、オンラインゲームに使用されたとされています。
■欧米諸国のゲーマー人口と使用金額(Newzoo調べ)
米国:1億8350万人・253億ドル(約2兆3384億円)
英国:3110万人・37億800万ポンド(約5161億円)
ドイツ:3550万人・36億5000万ユーロ(約4284億円)
フランス:2540万人・35億6000万ユーロ(約4178億円)
オランダ:930万人・5億9500万ユーロ(約698億円)
ベルギー:470万人・5億7000万ユーロ(約669億円)
最も多数のゲーマー人口を擁し多額のお金を使っているのが米国。単純計算すると米国市場は英国の約4倍、ドイツの5倍の規模を持っていることになりますから、その大きさと重要さが分かります。
欧州 
2010 
2009 
欧州2009年末累計(万台)
PS2 PS3 360 Wii
英 950 290 480 660
仏 590 210 160 430
独 610 160 110 320
西 580 140 70 230
伊 460 100 80 150
斯 260 80 90 100
計 3450 980 990 1890
2009年間実売まとめ(万台/万本)
日HW 日SW 米HW 米SW 欧HW 欧SW 計HW 計SW
PS2 ..26 151 190 1851 .76 1731 .292 .3733
PS3 .173 609 480 3715 390 3435 1043 .7759
Wii 198 1052 .1040 7869 570 4486 1808 13407
360 .33 ..108 550 5638 268 3012 .851 .8758
PSP 231 670 257 1329 174 1082 .662 .3081
NDS 403 2116 1214 6563 798 4323 2415 13002
計 1064 4706 .3731 26965 ..2276 .18069 .7071 49740
欧州年間ソフト売上げ
08→09
DS:5407万本→4323万本(-1084万本)
PSP:1439万本→1082万本(-357万本)
Wii:4308万本→4486万本(+178万本)
360:2573万本→3012万本(+439万本)
PS3:2666万本→3436万本(+770万本)
PS2:3064万本→1731万本(-1333万本)
2008年 
ゲーム市場規模
順位 国名 人口 単価 規模 シェア 伸び率
01位 米国 30609万人 *6508円 19920億円 40.42 16.87 アメリカ
02位 英国 *6098万人 10122円 *6172億円 12.57 *5.81 イギリス
03位 日本 12743万人 *4572円 *5826億円 11.87 -5.64 日本
04位 仏蘭 *6245万人 *6009円 *3753億円 *7.64 *5.76 フランス
05位 独逸 *8206万人 *4281円 *3513億円 *7.16 -0.03 ドイツ
06位 加奈 *3360万人 *5625円 *1890億円 *3.85 39.33 カナダ
07位 西班 *4616万人 *3955円 *1825億円 *3.72 -12.2 スペイン
08位 伊太 *5991万人 *2687円 *1610億円 *3.28 *8.49 イタリア
09位 豪州 *2170万人 *5641円 *1224億円 *2.49 *1.92 オーストラリア
10位 和蘭 *1649万人 *5124円 **845億円 *1.72 16.60 オランダ
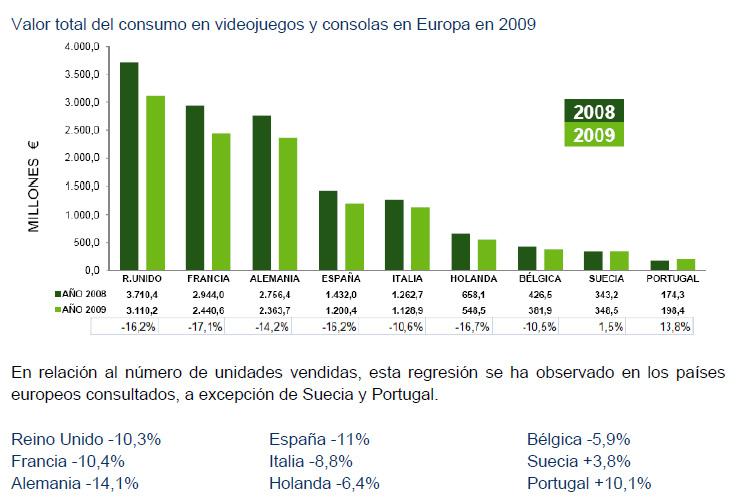
Country		2007			2008			Change
USA		$18,850,700,000		$22,031,000,000 	16.87%
Japan		$6,828,463,769		$6,443,666,600 		-5.64%
United Kingdom	$6,450,888,000		$6,825,961,080 		5.81%
France		$3,924,290,200		$4,150,274,560 		5.76%
Germany		$3,886,343,800		$3,885,243,440 		-0.03%
Spain		$2,298,919,400		$2,018,747,680 		-12.19%
Italy		$1,641,181,800		$1,780,501,620 		8.49%
Canada		$1,500,000,000		$2,090,000,000 		39.33%
Australia	$1,328,300,000		$1,353,772,000 		1.92%
Netherlands	$801,617,700		$934,657,620 		16.60%
Sweden		$545,479,500		$483,540,820 		-11.35%
Belgium		$509,114,200		$603,368,720 		18.51%
Switzerland	$420,462,420		$414,807,629 		-1.34%
Portugal	$256,138,200		$245,294,760 		-4.23%
Finland		$127,752,880		$121,942,510 		-4.55%

Total		$49,369,651,869		$53,382,779,039 	8.13%

Europe		$20,862,188,100		$21,464,340,439		2.89%
Source: MC/GfKhttp://adese.es/pdf/DATOS_INDUSTRIA_08.pdf
R.Unido = United Kingdom
Francia = France
Alemania = Germany
España = Spain
Italia = Italy
Holanda = Holland
Belgica = Belgium
Suecia = Sweden
Portugal = Portugal
ヨーロッパでのXbox 360 販売台数が500万台を突破 
247 名前:名無しさん必死だな[sage] 投稿日:2008/06/28(土) 14:44:34 ID:5VOyygI+0
ヨーロッパでのXbox 360 販売台数が500万台を突破
http://www.mcvuk.com/news/30991/360-hits-five-million-in-Europe
マイクロソフトヨーロッパのインタラクティブエンターテイメント
部門戦略マーケティング担当副社長David Gosen氏は、ヨーロッパでのXbox 360
販売台数が500万台を突破したと明らかにしています。
またGosen氏は「巷のレポートに反して、Xbox 360の
販売台数は少なくとも75万台はPS3を上回っています」と発言しています
Spain 2008 Report: http://www.adese.es/pdf/anuario-memoria-2008.pdf
Also includes worldwide revenue in Euros:
AMERICA
USA: 15,471 Millions ?
Canada: 632 Millions ?
TOTAL = 16,103 Millions ?
AUSTRALIA: 907 Millions ?
EUROPE
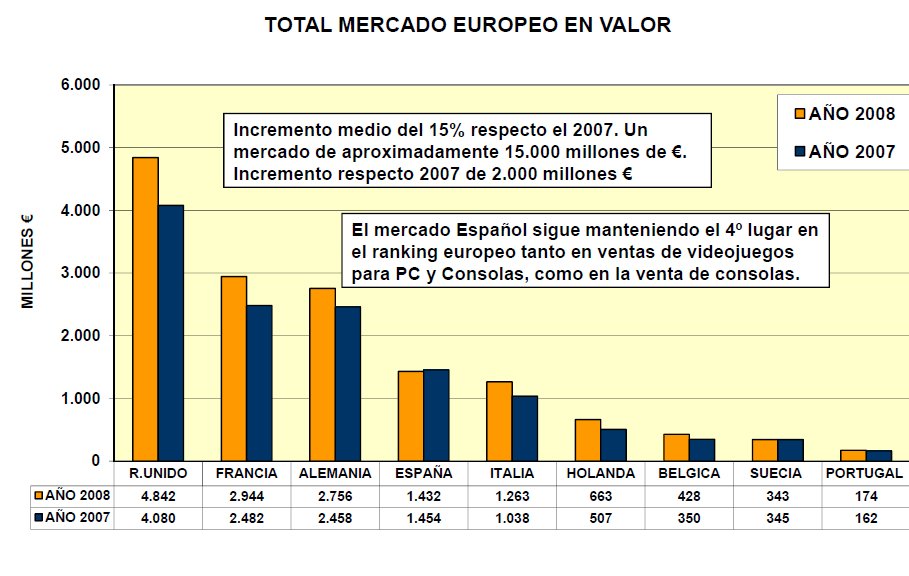
UK: 4,842 Millions ?
France: 2,944 Millions ?
Germany: 2,756 Millions ?
Spain: 1,432 Millions ?
Italy: 1,263 Millions ?
Netherlands: 663 Millions ?
Belgium: 428 Millions ?
Sweden: 343 Millions ?
Portugal: 174 Millions ?
TOTAL = 14,845 Millions ? (15,752 Millions ? with Australia)
JAPAN: 5,000 Millions ?
05-24-2008 
PS3 = 100.000 till end of March in Ireland.
Updated the chart again incl. sources for every country.
countries included: UK, France, Germany, Spain, Italy, Belgium, Netherlands, Luxembourg, Norway, Austria, Switzerland, Ireland, Poland.
countries lacking: complete eastern Europe and all scandinavian countries, except Norway.
Quote:
Quote:
United Kingdom:
Wii: 2.562.000 [till end of March 08]
360: 2.000.000 [till 04/06/2008]
PS3: 1.063.000 [till end of March 08]
_____________________________________
source: ELSPA/ChartTrack, Screen Digest
Quote:
France till end of March 08:
Wii: 1.470.000
PS3: 630.000
360: 610.000
_____________________________________
source: GfK
Quote:
Germany:
Wii: 920.000 [till end of March 08]
PS3: 400.000 [till end of March 08]
360: 384.000 [till end of Dec. 07]
_____________________________________
source: GfK/Media Control
Quote:
Spain till end of Dec. 07:
Wii: 660.000
PS3: 410.000
360: 225.000
_____________________________________
source: AC Nielsen
Quote:
Italy till end of March 08:
PS3: 454.000
360: 383.500
Wii: 333.000
_____________________________________
source: GfK
Quote:
Benelux till end of Apr. 08:
Wii: 421.000
360: 300.000 [minimum]
PS3: 300.000
_____________________________________
source: SONY
Quote:
Norway:
Wii: 69.882 [till end of Apr. 08]
PS3: 68.938 [till end of Apr. 08]
360: 45.000 [till end of Dec. 07]
_____________________________________
source: NG&MA
Quote:
Austria till end of Nov. 07:
360: 47.000
Wii: 40.000
PS3: 34.000
_____________________________________
source: GfK
Quote:
Switzerland:
Wii: 100.000 [till end of Dec. 07]
PS3: 20.000 [till 04/08/07]
360: ??.???
_____________________________________
source: swiss newspaper "Heute", SONY
Quote:
Ireland till end of March 08:
PS3: 100.000
Wii: ???.???
360:???.???
_____________________________________
source: SONY
Quote:
Portugal till end of Nov. 07:
PS3: 30.000
Wii: 8.000 - 12.000
360: 7.000 - 10.000
_____________________________________
source: GfK
Quote:
Poland till end of Sep. 07:
360: 20.000
Wii: 10.000
PS3: 10.000
_____________________________________
source: SONY
Quote:
Total:
Wii: 6.597.882
360: 4.024.500
PS3: 3.519.938
2007年 
ヨーロッパ各国売上
http://www.neogaf.com/forum/showpost.php?p=9624841&postcount=1
イタリアがオチ
United Kingdom:
Wii: 2.000.000 [till end of December 07]
360: 1.550.000 [till end of September 07]
PS3: 754.000 [till end of December 07]
Quote:
France till end of December:
Wii: 1.280.000
360: 589.000
PS3: 563.000
Quote:
Germany:
Wii: 800.000 [till end of December 07]
360: 328.000 [till end of October 07]
PS3: 172.000 [till end of October 07]
Quote:
Spain till end of December:
Wii: 660.000
PS3: 362.000
360: 225.000
Quote:
Italy till end of December:
PS3: 334.000
360: 299.000
Wii: 257.500
VG Market Percentage 2007

UK:		31.76%
France:		19.32%
Germany:	19.13%
Spain:		11.32%
Italy:		8.08%
Holland:	3.95%
Sweden:		2.96%
Belgium:	2.51%
Portugal:	1.26%

Code:
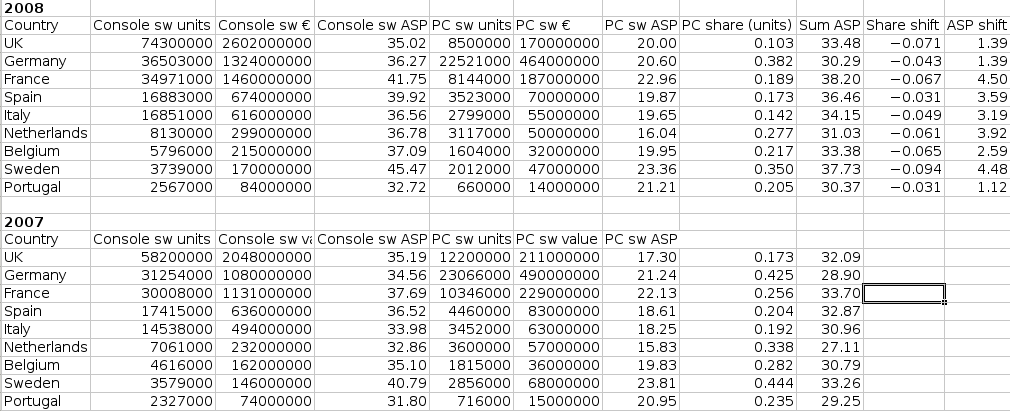
Console Software Sales Percentage 2007

UK:		34.52%
Germany:	18.54%
France:		17.80%
Spain:		10.33%
Italy:		8.62%
Holland:	4.19%
Belgium:	2.51%
Sweden:		2.12%
Portugal:	1.38%

		Percent	Num
UK		22.56%	4080
France		13.72%	2482
Germany		13.59%	2458
Spain		8.04%	1454
Italy		5.74%	1038
Russia		5.51%	997	*
Australia	4.01%	725	*
Holland		2.80%	507
Turkey		2.17%	393	*
Sweden		1.91%	345
Switzerland	1.87%	337	*
Poland		1.86%	337	*
Belgium		1.78%	322
Norway		1.66%	301	*
Austria		1.65%	299	*
Greece		1.61%	290	*
Denmark		1.40%	253	*
Ireland		1.14%	206	*
Finland		1.06%	192	*
Portugal	0.90%	162
Czech Republic	0.76%	137	*
Romania		0.71%	129	*
Hungary		0.61%	111	*
Ukraine		0.59%	107	*
New Zealand	0.56%	101	*
Kazakhstan	0.43%	78	*
Slovakia	0.32%	58	*
Croatia		0.23%	41	*
Serbia		0.18%	33	*
Bulgaria	0.18%	32	*
Belarus		0.17%	32	*
Azerbaijan	0.14%	25	*
B&H		0.06%	11	*
Georgia		0.04%	8	*
Moldova		0.02%	3	*
2006年 
2006海外<国・地域>別シェア
NDS 23 23 34 44 38 33 30 20 32
PSP 13 11 20 18 12 12 18 17 18
GBA 14 15 06 02 07 07 06 10 06
PS2 20 20 16 19 25 30 24 42 35
PS3 03 03 ─ ─ ─ ─ ─ ─ ─
Wii 05 05 04 06 06 03 04 02 02
360 17 15 17 07 06 09 12 07 05
他 05 08 03 04 06 06 06 02 02
左から・・米、加、英、仏、独、スカンジナビア、ベネルクス、伊、西
単位は%
2004 
2004年末時点各社発表出荷台数集計
ハード 日本(*アジア) 北米 欧州(*他地域合) 合計
PS2 1,947万台 3286万台 2906万台 8139万台
Xbox 170万台 1320万台 500万台 1,990万台
GC 348万台 1011万台 413万台(アジア含む?) 1803万台
GBA 1548万台 282万台 1744万台 6574万台 (参考数字)
2004年の世界各地域のゲーム機販売台数(単位:万台)
| PS2 | Xbox | GC | |
| 日本 | 1657 | 46 | 361 |
| 北米 | 2880 | 1290 | 990 |
| 欧州 | 2280 | 480 | 360 |
| 計 | 6817 | 1816 | 1711 |
出典:「ファミ通ゲーム白書2005」(エンターブレイン)
http://www.bloomberg.com/apps/news?pid=90003017&sid=acJUXt_mto.Q&refer=jp_news_index
http://www.famitsu.com/game/news/2005/05/23/103,1116813132,39534,0,0.html
2003 
欧州市場では PS2(1560万)>>>>箱(230万)>GC(160万)か。(8/27)
アメリカと似たようなもんだな。
Screen Digest claims the installed base for Europe / Middle East / Africa / Australia as of recently were:
PS2 - 15.6M (July 31st)
Xbox - 2.3M (June 30th) (edit - 2.3, not 2.1)
GC - 1.6M (June 30th)
http://forums.gaming-age.com/showthread.php?threadid=53305
http://news.moneycentral.msn.com/ticker/article.asp?Feed=RTR&Date=20030827&ID=2822335&Symbol=US:MSFT
2002 
ELSPA、英国ゲーム白書を発表 - 欧州の市場規模は7,639億円
http://gameonline.jp/news/2003/09/03002.html
<市場規模> - 欧州各国のもの合わせて
イギリス : 17億1,900万ユーロ (2,183億1,300万円)
ドイツ : 11億9,600万ユーロ (1,518億9,200万円)
フランス : 9億9,000万ユーロ (1,257億3,000万円)
北欧5カ国: 4億7,600万ユーロ ( 604億5,200万円)
イタリア : 4億3,800万ユーロ ( 556億2,600万円)
スペイン/ポルトガル: 4億1,500万ユーロ (527億 500万円)
ベルギー : 3億4,300万ユーロ (435億6,100万円)
オーストリア/スイス: 2億5,900万ユーロ (328億9,300万円)
アイルランド: 1億2,000万ユーロ (152億4,000万円)
2002年
1) ELECTRONIC ARTS Total 37,503,500 $1,695,848,939
2) TAKE 2 INTERACTIVE Total 16,370,096 $729,252,590
3) SONY Total 15,667,089 $559,622,824
4) ACTIVISION Total 10,577,102 $440,662,260
5) NINTENDO OF AMERICA Total 8,756,063 $411,078,376
7) THQ Total 7,335,178 $291,193,482
8) ATARI Total 7,292,317 $305,258,014
9) SEGA OF AMERICA Total 6,990,270 $288,763,871
10) KONAMI OF AMERICA Total 6,181,299 $253,050,366
任天堂のシェア7.5% 日本のシェア32% (EA32%)
2002年ゲーム機市場:日本は20%減、欧米好調-エンターブレイン
http://quote.bloomberg.com/apps/news?pid=80000006&sid=aGaJIqnIj4Bg&refer=top_kigyo
北米と欧州の調査結果はエンターブレインと協力関係にある
米International Development Group社の提供による
北米ゲーム機市場(単位:1000台)
メーカー名 機種           2001年   2002年   前年比
SCE プレイステーション      2,411.0   2,380.0  - 1.3%
SCE プレイステーション2     6,552.0   9,150.0  +39.7%
任天堂 NINTENDO64          1,053.0    166.0  -84.2%
任天堂 ゲームキューブ        1,290.0   2,510.0  +94.6%
マイクロソフト Xbox       1,500.0   3,445.0  +129.7%
任天堂 ゲームボーイ(カラー含む)  2,996.0    140.0  -95.3%
任天堂 ゲームボーイアドバンス    5,301.0   7,510.0  +41.7%
合計                 21,103.0   25,301.0  +19.9%

欧州ゲーム機市場(単位:1000台)
メーカー名 機種           2001年   2002年   前年比
SCE プレイステーション      2,099.0   1,470.0  -30.0%
SCE プレイステーション2     4,433.0   6,018.0  +35.8%
任天堂 NINTENDO64           275.0     79.0  -71.3%
任天堂 ゲームキューブ         未発売   1,200.0
マイクロソフト Xbox        未発売   1,446.0
任天堂 ゲームボーイ(カラー含む)  2,781.0    636.0  -77.1%
任天堂 ゲームボーイアドバンス    2,472.0   2,732.0  +10.5%
合計                 12,060.0   13,581.0   +12.6%

日本ゲーム機市場(単位:台数)
メーカー名 機種          2001年度   2002年度  前年度比
SCE プレイステーション2    4,053,084  3,406,439  -16.0%
SCE プレイステーション      644,859   182,129  -71.8%
任天堂 ゲームキューブ       1,289,169   853,534  -33.8%
マイクロソフト Xbox       190,092   187,389  - 1.4%
任天堂 ゲームボーイアドバンス   4,079,225  3,272,790  -19.8%
任天堂 ゲームボーイアドバンスSP  未発売    594,939
任天堂 ゲームボーイカラー      243,091    61,578  -74.7%
バンダイ ワンダースワンカラー    217,529    62,091  -71.5%
合計                10,916,187  8,757,962  -19.8%
(●´ ー `)<日本だけ年度?
USA PCF EU TOTAL
PS2 1587 1400 1000 4000
GC* 358 220 150 728
XB* 460 85 180 725
GCはオーストラリア、日本以外のアジアでは各10万ほどしか売れていないものと仮定。
PCF・・・アジア、日本、オセアニア
欧州 2002年ハード売り上げのまとめ
PS2 600万
GBA 300万
GC 150万(確定)
X-BOX 140万
20029月末
海外ハード、ソフトの売り上げ(2002年9月末

SCEハード
    中間期実績  累計 通期予想
国内 123       1098
海外 1155      3058
累計 1278      4156  ?

PS2ソフト
    中間期実績  累計 通期予想
国内 1360      6100
海外 5530      16800
合計 6890      22900  ?

                 中間期実績  累計 通期予想
ゲームボーイアドバンス ハード 国内  108    705
               海外  471    1689
               合計  578    2394  1500
            ソフト 国内  498    1793
               海外 1646    5329
               合計 2144    7122  5000
キューブ     ハード 国内  34    191
               海外  254    477
               合計  288    668  1000
            ソフト 国内  201    608
               海外 1820    2850
               合計 2021    3458  5500
2002年6月時点(?)でのハードの売り上げ
PS 北米26.8 PAL34.6 日本17
PS2 北米9.2 PAL7.6 日本8.5
N64 北米18.1 PAL7.6 日本6.6
DC 北米4.1 PAL1.8 日本2.0
箱 北米2.1 PAL0.45 日本0.18
GC 北米1.7 PAL0.45 日本2.0
2001 
2001年UK TOP10
1 ミリオネア UK
2 WWF2 日本
3 GTA3 UK
4 ハリポタ UK
5 GT3 日本
6 ゼルダ時オカ 日本
7 fifa2001
8 WWE 日本
9 fifa2002
10 007
2001年北米 TOP10
1 GTA3 UK
2 マッデンNFL2002
3 ポケモンクリスタル 日本
4 メタルギアソリッド2 日本
5 スーパーマリオアドバンス 日本
6 グランツーリズモ3 日本
7 トニホ3
8 トニホ2
9 ポケモン銀 日本
10 ドライバー2 UK
2000 
2000年開発会社国籍別(SCEAとかも日本?)世界シェア
US 44.1
日本 35.3
UK 15.3
ドイツ 2.1
フランス 1.7
カナダ 1.5
Top Console Publishers
2000
1 Nintendo 26,807,180 $955,169,820
2 Electronic Arts 11,946,160 $435,493,079
3 Activision 9,775,986 $332,803,304
4 THQ 6,956,563 $262,998,114
5 Sega 6,332,560 $262,494,552
6 Sony 8,927,900 $244,438,591
7 Midway 4,058,503 $135,982,929
8 Acclaim 4,684,894 $134,503,569
9 Capcom 3,633,586 $124,124,609
10 Infogrames 3,913,971 $112,687,963
任天堂のシェアは30% 日本のパブリッシャーのシェアは53%
2000年パブリッシャー世界ランキング(単位はポンドだべか?)
1 EA 937.9
2 インフォグラムス(フランス) 500
3 アクティヴィジョン 442.9
4 スクウェア 399.3
5 コナミ 335.0
6 TAKE2(フランス?) 299.3
7 havas/vivendi(フランス) 255.7
8 THQ 240.0
9 エニックス 192.9
10 カプコン 179.3
11 ナムコ 170.7
12 UBIソフト(フランス) 162.9
13 エイドス(UK) 145.7
14 TLTUS?(フランス) 111.4
15 アクレイム 95.7
その他世界市場オタには興味深いデータがある(ありそう?)なので、一度目を通してみるといいかも。。。
http://www.dti.gov.uk/cii/services/contentindustry/main.pdf
その他 
ファミ通ゲーム白書2009より
08年間欧州全体(万台/万本)
ハード DS:1101 Wii:773 PS3:331 360:323 PSP:262 PS2:126
ソフト DS:5407 Wii:4308 PS3:2666 360:2573 PSP:1439 PS2:3064
08年末迄欧州全体累計(万台)
ハード DS:3120 Wii:1397 PS3:686 360:782 PSP:1222 PS2:3821
360 Wii PS3
イギリス 320 490 190
フランス 120(09/01) 285 130(09/01)
ドイツ 33(07/10) 80(07/10) 17(07/10)
スペイン 23(07/12) 66(07/12) 36(07/12)
イタリア 55(08/10) 69(08/10) 66(08/10)
オーストラリア 54 98 37
カナダ 118 150 73
メキシコ 55(07/12) 22(07/12) 6(07/12)
ソースはGfk、NPD
単位は万台、記述ないものは2008/12までの累計
欧州累計ハード売上(2005年終了時点まで)
PS2 GBA XBX GCN
英 800万 470万 200万 110万
仏 490万 300万 100万 *90万
独 400万 120万 *90万 *90万
西 430万 210万 *20万 *10万
伊 310万 110万 *40万 **5万
北欧 180万 200万 *50万 *20万
毎日更新次世代ゲーム機売上比較
http://www.gamesystemwars.com/index.cfm
http://nexgenwars.com/
JAP US PAL
SNES 17.15 23.35 8.58 49.08
N64 5.55 20.63 6.75 32.93
GEN 3.59 17.80 9.36 30.75
ソース元 
NeoGAF - Gaming Discussion
http://www.neogaf.com/forum/forumdisplay.php?f=2
Chart Track(英・愛・丁)
http://www.charttrack.co.uk/
gamona(独)
http://www.gamona.de/
aDeSe - Los mas vendidos(西)
http://www.adese.es/web/top.asp
GfK Australia(豪・新)
http://www.gfk.com.au/Charts/Entertainment/Interactive_Games.htm
GfK Dutch(蘭)
http://www.dutchcharts.nl/game_charts.asp
GfK Group
http://www.gfk.com/
The NPD Group
http://www.npd.com/
ELSPA
http://www.elspa.com/
SIEA(スイス)
http://www.siea.ch/
IGN.com
http://www.ign.com/
GameSpot
http://www.gamespot.com/
GameDaily BIZ
http://biz.gamedaily.com/
Gamasutra
http://www.gamasutra.com/
Edge Magazin
http://www.edge-online.com/
GamesIndustry.biz
http://www.gamesindustry.biz/
MCV
http://www.mcvuk.com/
JEUXFRANCE.COM
http://www.jeux-france.com/
GameFront
http://www.gamefront.de/
XNEWS
http://www.xbox-news.com/
INSIDE
http://www.inside-games.jp/nintendo/
PS3 FAN
http://www.ps3-fan.net/

 新規
新規 編集
編集 添付
添付 一覧
一覧 最終更新
最終更新 差分
差分 バックアップ
 凍結
凍結 複製
複製 名前変更
名前変更 ヘルプ
ヘルプ